As part of our end of the year lookback at oil and gas activity in Oklahoma, we’re taking a look at transfer activity over the past 12 months.
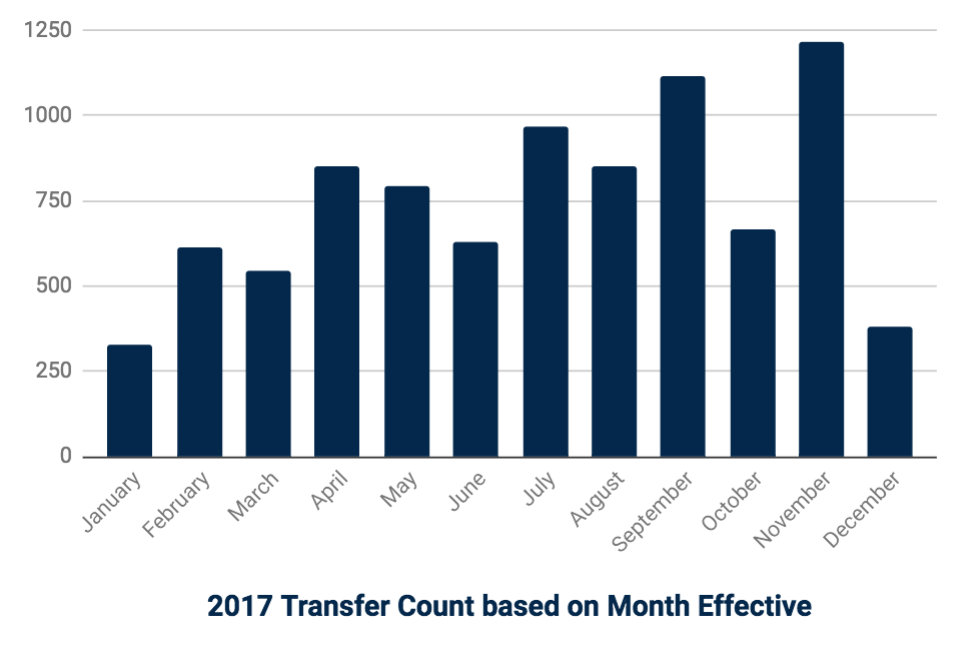
This graph shows a general increase in transfer activity as the year progresses (note December only includes data up to 12/14, when this report was compiled).
For even more detail, here is a timelapse video from Atla showing the progression of activity over the course of the year.
Want more details? Contact us at hello@oseberg.io, and we'll walk you through the data.